The Franchise Development Dashboard: What to Track and Why
Part of our complete guide: Franchise Lead Follow-Up With AI
A good franchise development dashboard answers one question: where are candidates getting stuck, and whose pipeline is it in?
For the firm in our case study, we built one that pulls leads, appointments, referrals and sources by consultant on an automatic schedule. Nobody builds a report by hand anymore. Here's what we'd put on yours.
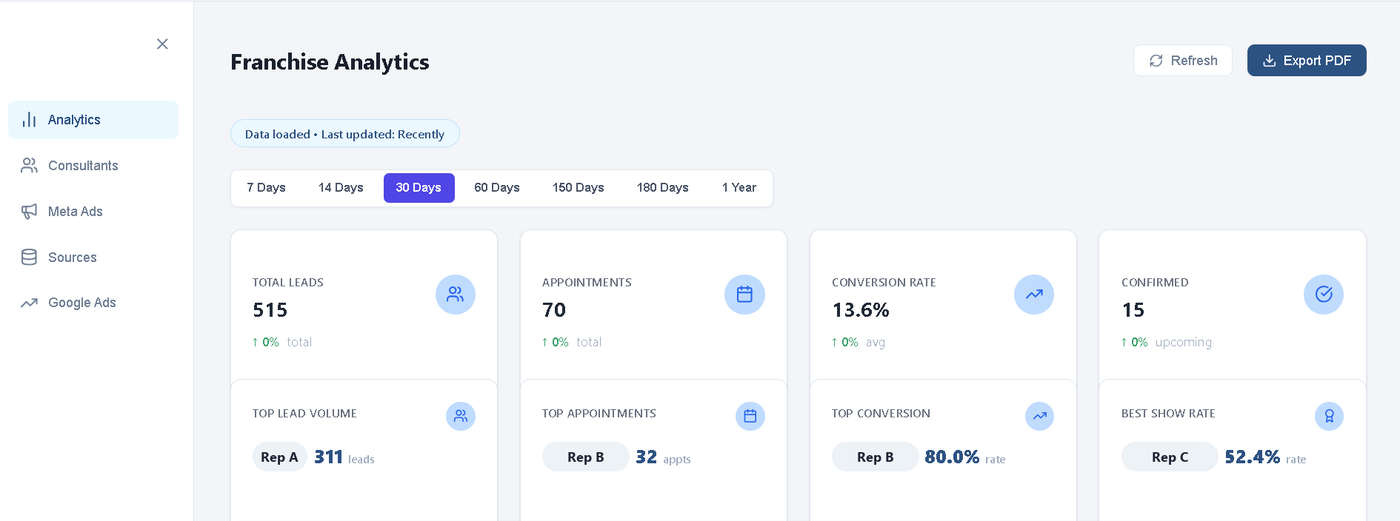
The numbers worth tracking
| Metric | How to define it | Published benchmark |
|---|---|---|
| Cost per lead | Spend divided by new leads, by source | $351 in 2025 |
| Time to first touch | Inquiry to first real human or AI contact | 9.1 hours average first email reply |
| Ever phoned | Share of leads with at least one call | 44% of brands called a mystery shopper |
| Lead to appointment | Leads who book an intro call | Track your own |
| Show rate | Booked meetings that actually happen | Track your own |
| Touches in 14 days | Calls, texts and emails per lead | Track your own |
| Stale leads | Open leads with no activity in 30 days | Aim for zero |
| Lead to agreement | Signed deals over leads | 2%, or 1.5% on FranConnect data |
The AFDR and FranConnect figures measure different groups in different ways, so compare yourself to each one separately. Don't average them.
Show rate and lead to appointment are the two we weight most early on, because you see them in weeks. A signed deal takes about 24 weeks to show up.
- MinutesTime to first touch
- DaysContact rate
- WeeksLead to appointment, show rate
- About 24 weeksSigned agreements
Show every number by consultant
Totals hide the most useful information. In our work, one person's book can look completely different from the rest of the team's once you split it out.
Rep-level views should show leads assigned, first-touch time, appointments, show rate and deals. The point isn't to punish anyone. Usually you'll find something to copy from your best performer.
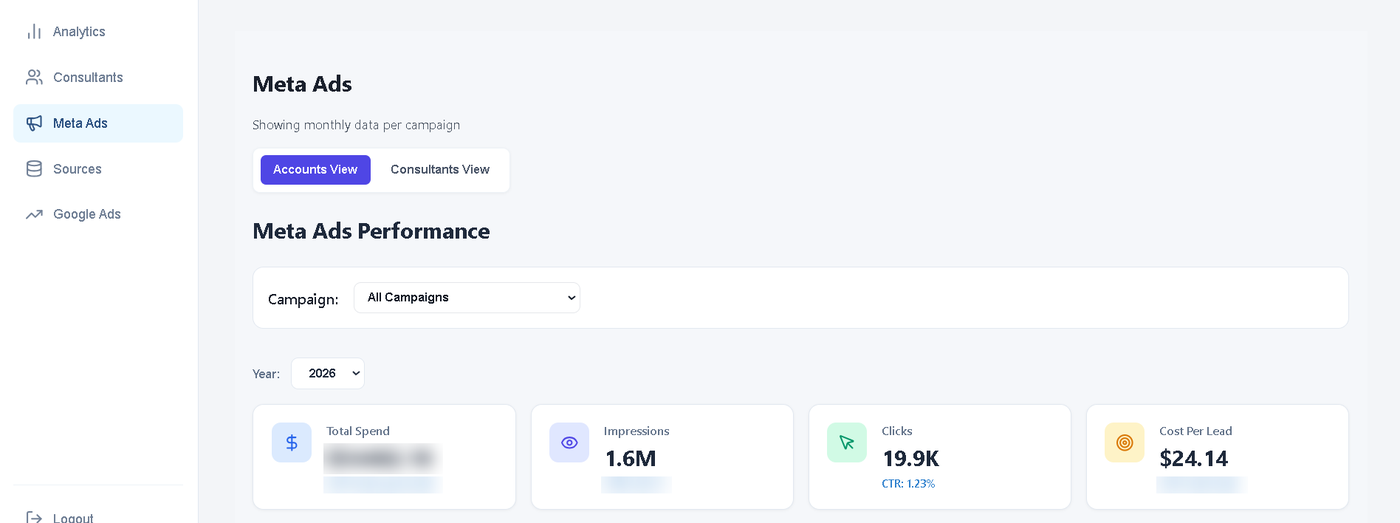
Four ways dashboards go wrong
- Counting calls as people
A callback count is a count of calls. One person can ask twice.
- Comparing against an import
Loading old contacts makes that month's lead count fake.
- Missing calendars
One rep's appointments were under-counted because of a personal calendar setup.
- Empty outcome fields
If nobody records whether a meeting happened, show rate is a guess.
How ours is built
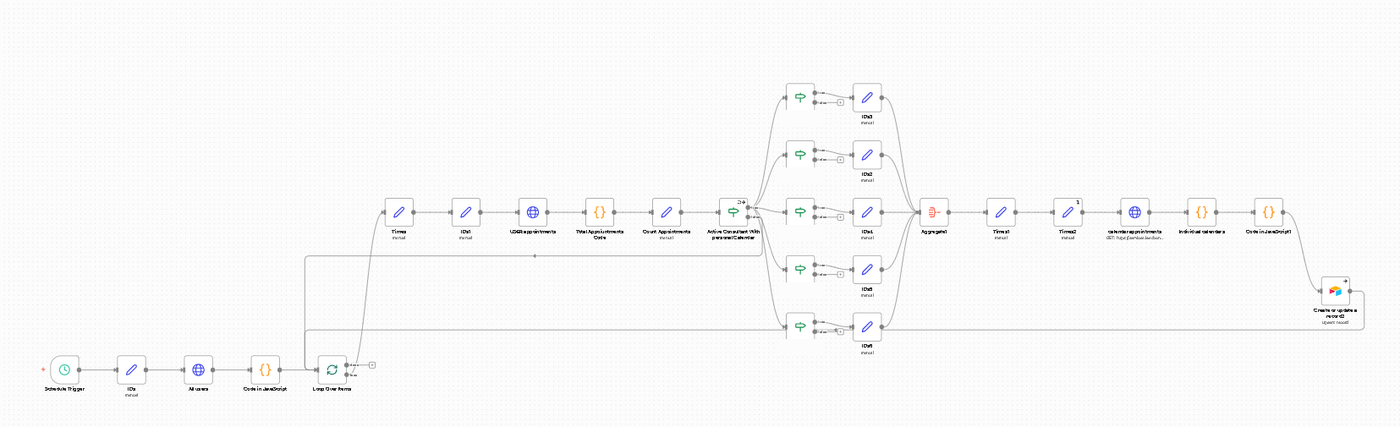
The setup is simple. Scheduled n8n workflows pull from the CRM and calendars, calculate the numbers per consultant and store the results. The dashboard reads from that store.
- CRM and calendarsWhere the data lives
- n8n on a schedulePulls it automatically
- Math in codePer consultant
- DatabaseStores the results
- DashboardReads from the store
Doing the math in code means the same question always gets the same answer. If two people pull a number and get two results, the team stops trusting the dashboard.
None of this works without every source in one CRM.
Where a dashboard stops
A dashboard only answers the questions you thought to build a chart for. The biggest leaks tend to be in questions nobody asked, such as which qualified candidates never got a meeting.
That's the job of the AI RevOps Engine, which reads the same data and lets you ask anything.
For the results this setup supported, including what we won't claim, read the case study.